
Last month we put revenue next to your audience, down to the individual article. The follow-up question is always the same: “can I see it broken down by the thing I actually care about?” Too often the honest answer across analytics tools is “export it and rebuild it somewhere else” – and you end up in yet another dashboard, one more place to maintain, one more copy of the truth.
This month we went the other way. The headline release keeps you inside Alke and bends the report to your question. Then, for the cases where the data genuinely has to travel, we made leaving clean too.
Report tables, on your terms – and saved for next time
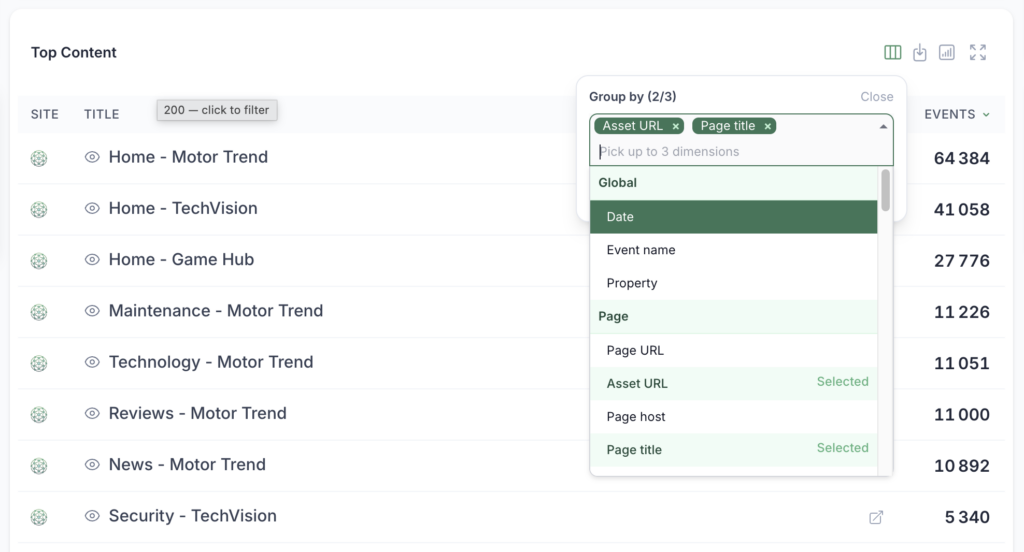
Every report table used to show a fixed set of grouping columns. Sensible defaults – but your questions aren’t fixed, so now the columns aren’t either.
Look for Customize columns in a report table’s action bar. Swap the default groupings for up to three dimensions of your own choosing – the ones that matter for this question, on this table. Ask “which sources drive my best-monetizing sections?” one minute and “how does device split by country?” the next, and the answer forms right there in the report you’re already looking at. No export, no pivot table, no second tool to keep in sync.
That last point matters more than it sounds. Reshaping the view in place means there’s still one source of truth – the report everyone else sees, just angled to your question – instead of a detached spreadsheet that drifts the moment someone refreshes the real data.
Two details we care about:
- It travels in the URL. The columns you pick live in the link, so sending a teammate the exact view you’re looking at is just sending them the URL.
- It sticks to your Saved Views. When you save a view, your column layout is saved with it. Reopen the view next week and it comes back exactly as you left it – same columns, same shape.
We’ve wired this across the tables where it earns its keep – Overview, Performance, Monetization, Retention and Video. Same reports, now bent to the question in front of you.
When the data has to leave: Alke Analytics inside Google Sheets
Sometimes the number really does need to live somewhere else – a board deck, a revenue model, the weekly ops sheet that finance already runs on. For those cases, the answer shouldn’t be a manual CSV export you re-import by hand every week.
The new Google Sheets add-on lets you build and refresh Alke Analytics reports without leaving your sheet. Open Extensions → Alke Analytics, and a sidebar opens right next to your data. Pick your dates, dimensions, metrics and filters, hit refresh, and the rows land in the tab.
A few things that make it genuinely useful day to day:
- It’s yours, self-service. Connect it once with a personal token from your dashboard settings – no admin ticket, no shared credentials.
- Reports that refresh themselves. Set a report to run on a schedule and your sheet keeps itself current. The Monday-morning numbers are already there when you open the file.
- Filters that understand your data. Filters are type-aware – a date behaves like a date, a number like a number, a category like a category – so building the exact slice you want is quick and predictable.
Think of it as the escape hatch, not the destination: explore and answer questions in Alke, and pipe a report into Sheets only when it needs to plug into work that already lives there.
Video revenue, attributed to the right play
For publishers running video, ad revenue and the video itself have always lived slightly apart. Adding them into Alke Analytics was just the logic thing to do.
The result: video ad revenue attributes to the specific videoplay it belongs to – no backend changes on your side, and it slots cleanly into the async command queue you’re already using. Combined with last month’s per-article revenue, your video earnings now sit exactly where the rest of your monetization story does – and, with custom columns above, you can slice that revenue by whatever dimension you like without ever leaving the report.
The through-line this month is staying in flow. Reshape any table around the question you’re actually asking, keep one source of truth instead of a graveyard of exported copies, and reach for Sheets only when the data genuinely has to travel. As always, everything above is live in your dashboard today – go bend it to how you work.