
Two themes ran through April: making the dashboard remember how you work, and making it answer faster when you ask it questions you have asked before. We also started rolling out a brand-new building block that we believe will reshape how publishers measure their business — but more on that in our next post.
The report you actually open, opened by default
Most teams live in one or two saved views. Until now, every user landed on the same generic starting page and had to pick that view manually, every single time.
Each user can now choose a default saved view per organization. From the next login, Alke Analytics drops you straight into the report you actually use. Owners can also assign defaults on behalf of their team members from the user management page — a quick way to align a whole organization on the same starting point without anyone having to read a setup guide.
Custom dimensions, finally with real names
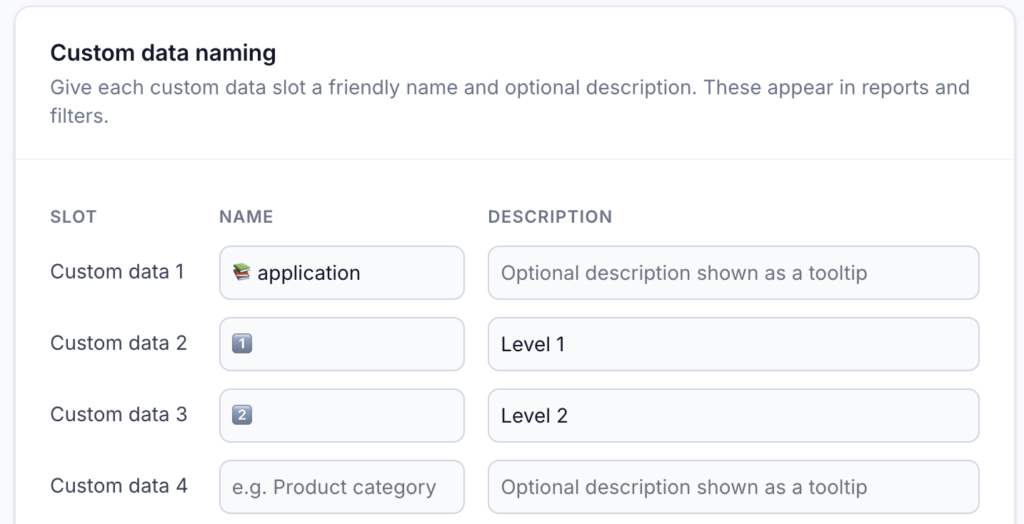
Custom data slots — cd1 through cd10 — are powerful, but only the person who set them up remembers what they mean. Every other user has to keep a mental cheat-sheet to translate cd3 into “Author” or cd7 into “Subscription tier”.
Organization owners can now name each slot from Settings, with a short label and an optional description. The label shows up everywhere the dimension appears: report titles, the filter bar, the filter picker, funnel step editors, even CSV export headers. Hover over a block in the Custom Data report and the description surfaces as a tooltip.
The result: dashboards that read like your business, not like a data spec.
A property selector that respects who is looking
Publishers running many properties across many users had a recurring papercut: the property picker showed every property in the organization, even those a given user could not open. Click on the wrong one, and you would hit a blank report.
The selector now only shows properties the current user can actually access — owners still see everything, while view, edit, and view-monetization permissions are honoured. No more stale filters cluttering your workspace when permissions change.
We also added a small quality-of-life touch: hovering on a row in the dropdown reveals an “Only” shortcut, so isolating a single property is now one click away instead of three.
Filter editing that keeps your context
Editing an existing filter used to reset your work: opening the autocomplete cleared the value you had carefully chosen, forcing you to type it again. The autocomplete now seeds itself with the current filter value and keeps it visible while you browse alternatives. If you change your mind mid-edit, your starting point is right there waiting.
Reports that keep up with you
The reports you reach for every day — last week’s revenue, last month’s audience, last quarter’s funnel — now open noticeably faster. Switching between date ranges, refining a filter, jumping from a chart to its underlying table: every one of those small back-and-forth steps that fill an analyst’s day feels lighter.
Making Alke Analytics feel instantaneous, even on heavy historical reports, is a continuous priority for us — and this release is a meaningful step in that direction.
Coming soon: a new building block for publishers
Behind the scenes, we have been quietly shipping the foundation of something new. It will let you pull the full picture of your activity. We will dedicate an entire post to it very soon.
In the meantime, log in and try the new defaults — most of these improvements show up the moment you open Alke Analytics.