
Ask any media executive a simple question: which article generated the most revenue last week? Not the most pageviews. Not the most engagement. Revenue. Actual euros contributed to the P&L.
The answer, almost every time, is some variation of “we’d have to pull a few reports and reconcile them, give us a couple of days.” For a question that should be answered in two clicks, in a sector whose entire economic model rests on monetizing content, that is an extraordinary situation.
It is also the norm.
A blind spot at the center of the business
In most media groups, pageviews are measured with millimetric precision. Engagement is tracked across dozens of dimensions. Audience cohorts are sliced and diced in every conceivable way. But revenue, the figure that actually pays the bills and ultimately determines which teams keep their jobs, is consolidated only at the aggregate level. Per site. Per day. Sometimes per month.
The detail, what each article actually earned, what each traffic source actually monetized at, what each editorial vertical actually contributed to the margin, simply doesn’t exist in any operational tool a publisher uses day-to-day. Not because the data isn’t there. It is. It sits in ad server logs, in prebid analytics, in SSP dashboards, in direct-sales reports. It just doesn’t sit next to the content that produced it.
This is not a minor inconvenience. It is a structural gap in the way media businesses are run. No e-commerce executive would tolerate knowing only their consolidated revenue without product-level detail. The question would be absurd: how do you allocate inventory, marketing spend, or commercial focus without it? Yet in publishing, this is the default operating state.
How we got here
The cause is structural, not accidental. Publishers outsourced their advertising sales decades ago. Ad servers, sell-side platforms, curation platforms, exchanges, ad networks: each link in the chain runs its own systems, builds its own reporting, and consolidates its own data. Revenue reaches the publisher through aggregated reports, but the granular signals, which user saw which ad, which page produced which yield, which placement contributed which margin, live with the intermediaries.
On the other side, analytics tools evolved in parallel, in their own silo. They were built to count audiences, not to measure revenue. They could tell you how many people read an article, how long they stayed, whether they scrolled. They couldn’t tell you how much that article was worth to your business, because the revenue data wasn’t in the system.
For fifteen years, this didn’t matter much. The digital advertising market was growing fast, audiences were expanding, and most publishers could absorb the inefficiency. As long as the curves trended up, knowing precisely which article made what was a nice-to-have, not a survival skill.
That window has closed. Search traffic dropped more than 30 percent globally in 2025. Press advertising revenues in France fell more than 8 percent over the first nine months of the year. Major media groups are announcing layoffs measured in hundreds of jobs. The market that allowed publishers to ignore the gap no longer exists, and the gap has become a critical operational problem.
When every pageview matters because there are fewer of them, knowing which ones actually pay matters too. When budgets must be cut, knowing which verticals contribute and which don’t is the difference between a coherent plan and across-the-board reductions that hit performers and underperformers equally. When acquisition channels must be prioritized, comparing actual revenue per source is not optional, it is the basis for any rational decision.
The tool I wish I’d had
I spent more than eight years running adtech for a media group operating over twenty international websites. Every week, I had to make decisions that should have been straightforward, and every week, I made them on incomplete information.
When a vertical underperformed, I couldn’t tell whether the problem was on the editorial side, on the ad layout, on the audience mix, or on the yield optimization done downstream by our partners. When a new section launched, I couldn’t compare its actual revenue contribution against existing sections with the precision the decision deserved. When traffic patterns shifted, I could see the audience moving but couldn’t see the revenue moving with it, until weeks later when the consolidated reports caught up. The result was a series of partial analyses, missed trends, and movements I could not explain to my own management.
I tried, repeatedly, to build this measurement layer with the tools available on the market. Adtech vendors had pieces of it. Analytics vendors had other pieces. Nothing fit. The data lived in too many places, in too many formats, on too many incompatible reference frameworks. Reconciling it at the page level, in a way that could be operated daily by non-technical teams, turned out to be a problem the market wasn’t solving.
Alke Analytics exists because that problem still isn’t solved, and because publishers and broadcasters are running out of room to wait for it. The advertising reconciliation feature released this week is the most direct expression of what I wanted to have, for years, and couldn’t.
The questions a publisher should be able to answer in 2026
Here are five questions that, in our view, define modern media business intelligence. They are the questions that determine whether a publisher pilots its business or merely reacts to its results.
Which articles produced the highest revenue this week, and which produced the highest revenue per minute of editorial time invested? These are different questions, and both matter. The first identifies winners. The second identifies efficiency.
Which traffic sources deliver the best RPM, and which deliver volume without monetization? In a market where search traffic is collapsing and social reach is shrinking, knowing the actual monetary return of each channel is the basis for every reallocation decision.
Which editorial verticals are profitable, which are loss-making, and which are quietly delivering the highest yield per resource consumed? Publishers maintain entire sections by inertia. Some of them carry the business. Some of them drain it. The difference is invisible without revenue attribution at the content level.
Which page formats and content types actually perform when measured against the revenue they generate? Long-form versus short-form, listicles versus deep dives, single-page versus paginated, text-heavy versus video-led: each format carries a different revenue profile, and the differences are usually invisible until they’re measured side by side against the same monetization data.
How does revenue actually flow through the content portfolio? Knowing, page by page, what each piece of content earns, in which categories, from which audiences, creates a foundation for internal conversations that previously had no factual basis: editorial priorities, resource allocation, performance reviews, strategic bets. The data doesn’t make those conversations for you, but it changes their starting point.
None of these questions can be answered with the tools most publishers use today. They require a single dataset that combines content, audience, and revenue, at the page level, in a single reference framework. That dataset doesn’t exist by default. We built it.
What we just released
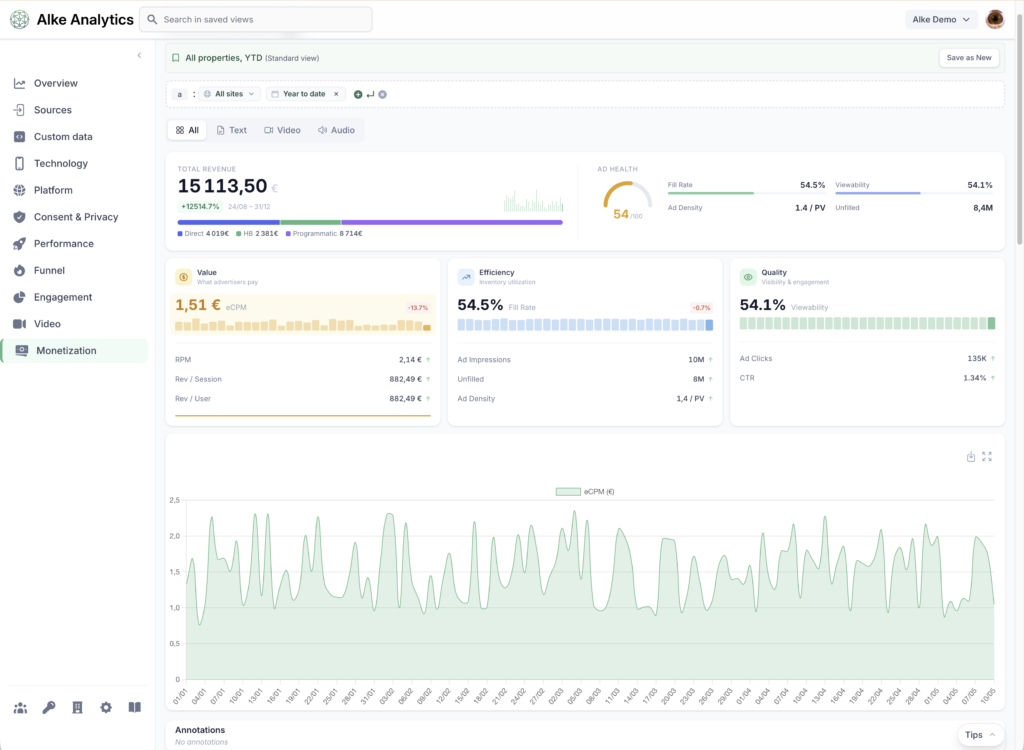
Alke Analytics now reconciles advertising metrics with the pageviews it collects, natively, with no additional tags, no extra integration on the publisher’s side, and no impact on the event volume billed under the standard plan. For every pageview tracked by Alke Analytics, the platform now also stores:
- The number of ad requests sent to the ad server
- The number of ads actually displayed
- The viewability of those ads, measured against the same standard the ad server uses
- The revenue generated, categorized by source: prebid, ad exchange and EBDA, and direct sales programmed in the ad server
- The clicks generated by those ads
Because these metrics are attached to the pageview, they inherit every dimension Alke Analytics already supports. Content type. Author. Editorial category. Traffic source. User segment. Late dimensions like consent status or engagement depth. They appear in every cross-property view, every filter combination, every comparative analysis the platform offers. They are accessible through the REST API and the scheduled exports.
This is, to our knowledge, the first time these metrics are available with this level of granularity, at the article level, across the full set of analytics dimensions, without manual reconciliation. Specialist yield management tools optimize advertising performance but live separately from editorial data. General-purpose analytics platforms don’t reconcile revenue at the pageview level. Native ad server reports don’t cross-reference with publisher analytics dimensions. The combination is what creates the lift.
The questions this unlocks
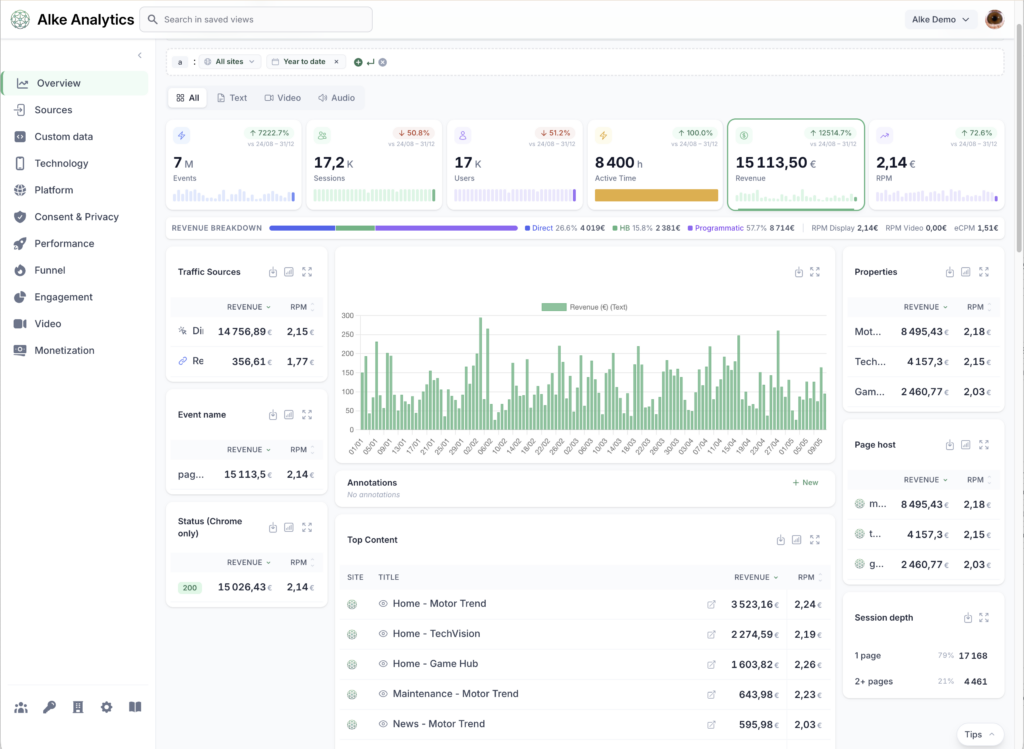
A publishing executive using this feature can answer, in two clicks, things that used to require a day of data wrangling.
What is the actual revenue per article, per section, per author? Not pageviews. Not engagement. Revenue, with the same precision as audience metrics.
What is the viewability rate on news pages versus opinion pages versus video pages? Across which page formats? Filtered by which audience segments?
What is the RPM per session, per user, per pageview, broken down by traffic source? Which acquisition channel actually pays, once you measure the revenue it produces rather than the volume it brings?
Which editorial decisions in the last quarter actually moved revenue, and which didn’t? Annotated against the platform’s existing event timeline, the answer becomes legible at a glance.
These are not exotic analyses. They are the foundation of operating a content business under pressure. Until now, they required hours of reconciliation across disconnected systems, and most publishers never produced them at all.
What this isn’t
This is not a yield management tool. We don’t optimize the auction. We don’t bid on impressions. We don’t replace the ad server, the prebid wrapper, or the SSP.
This is not an attribution platform. We don’t track marketing campaigns across third-party domains. We don’t deduplicate conversions across paid channels.
This is a measurement layer. It restores to the publisher what should always have belonged to the publisher: a unified view of audience, content, and revenue, in a single reference framework, at the page level. From that base, the publisher decides what to do with it, which conversations to have with intermediaries, which editorial bets to double down on, which channels to scale back.
Empowering publishers with technology
There is a broader principle behind this release. It is the principle Alke Tech was founded on: empowering publishers with technology. The tools publishers rely on should consolidate the reading of the business on the publisher’s side, not fragment it across partners who each capture a piece. They should treat audience, content, and revenue as a single system, because that is what they are inside the publisher’s P&L, even when adtech infrastructure has fragmented their measurement.
Alke Analytics is built around that principle. The advertising reconciliation feature is one expression of it. There will be others.
Publishers who spent the last decade adding partners to their stack now find themselves with rich operational complexity and impoverished strategic visibility. The way out is not another partner. It is a measurement layer that belongs to them, runs on their data, and answers their questions without intermediation.
This feature is available now to all Alke Analytics customers, at no additional cost. It is part of the standard plan, and it does not increase the event volume billed.
If you are a media group or a broadcaster operating across web, apps, or connected TV and you want to see what your articles actually earn, we’d be glad to show you. The fastest way to find out is to start a free trial. Seven days, no credit card, no commitment.
Alke Analytics is the analytics platform for European media groups and broadcasters. We measure audience, content, and revenue in a single reference framework, across web, mobile apps, and connected TV. One platform for every screen.