
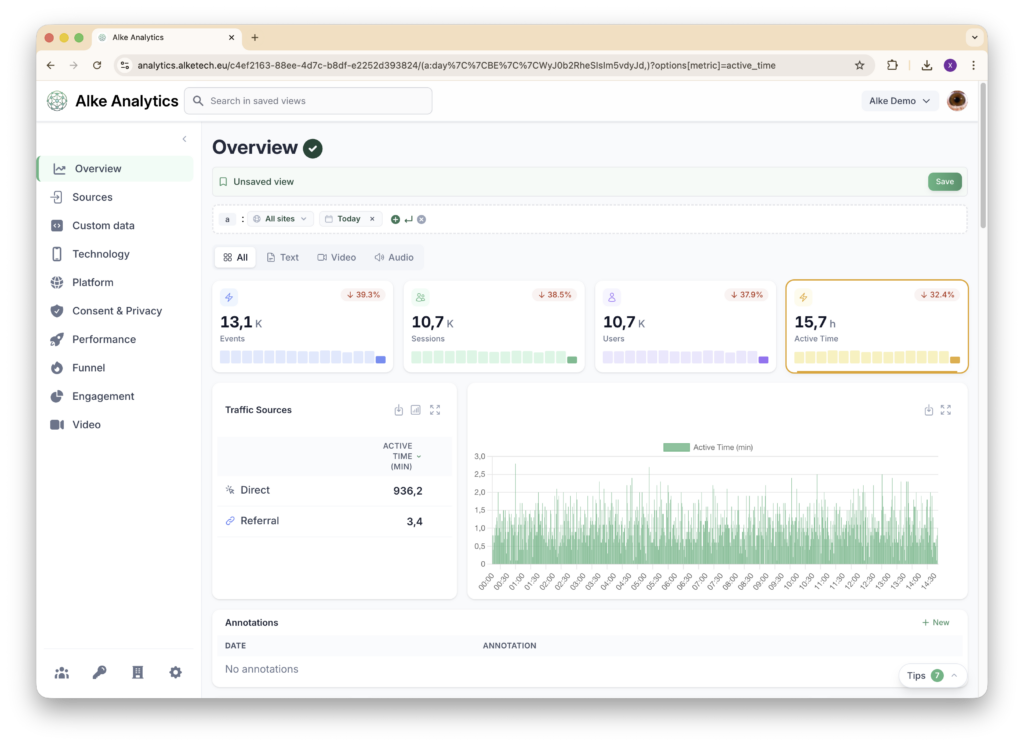
Pageviews tell you what loaded. Active time tells you what people actually consumed. This month, Alke Analytics introduces the active time metric, measured full-stack from collection to visualization. It also ships a completely redesigned dashboard experience.
Beyond pageviews: measuring real engagement
Active time tracks how long a user actively engages with your content. In other words, it doesn’t count how long a page sits open in a background tab. Instead, it counts how long someone is actually reading, scrolling, and interacting. The collector detects user activity and reports precise active time per page.
This metric is transformative for publishers. For example, picture a 5,000-word longform piece that keeps readers engaged for 8 minutes. It is fundamentally more valuable than a listicle readers abandon after 15 seconds. Yet both register a single pageview. Active time surfaces that difference.
It also matters for revenue. Active time and RPM are the two axes of the arbitrage quadrant in Goal Analysis. So sections that hold readers long but earn little in ads are often the best candidates for a subscription offer.
Full-stack implementation
Alke measures active time end-to-end. First, the JavaScript collector captures user activity with sub-second precision and encodes it efficiently for transmission. Then the server collector decodes and validates the data with configurable limits to ensure accuracy. Finally, the backend stores and aggregates active time for fast querying. The frontend then displays it across all relevant reports.
This isn’t a bolt-on feature. Instead, it runs deep in every layer of the Alke stack.
Choose the metric that matters to you
With active time now available alongside pageviews, sessions, and unique visitors, we’ve added a metric selector to all reports. Switch between metrics with a single click to see your data through different lenses. Want to rank your top pages by active time instead of pageviews? It’s one click away.

This flexibility lets different teams focus on the metrics that align with their goals. For example, editorial teams can prioritize engagement depth, while growth teams can focus on session volume.
A completely redesigned dashboard
January also marks the launch of a major UI overhaul. We redesigned the entire dashboard with a refreshed visual identity. It brings cleaner layouts, improved navigation, updated sidebar and navbar, and better responsiveness across screen sizes.
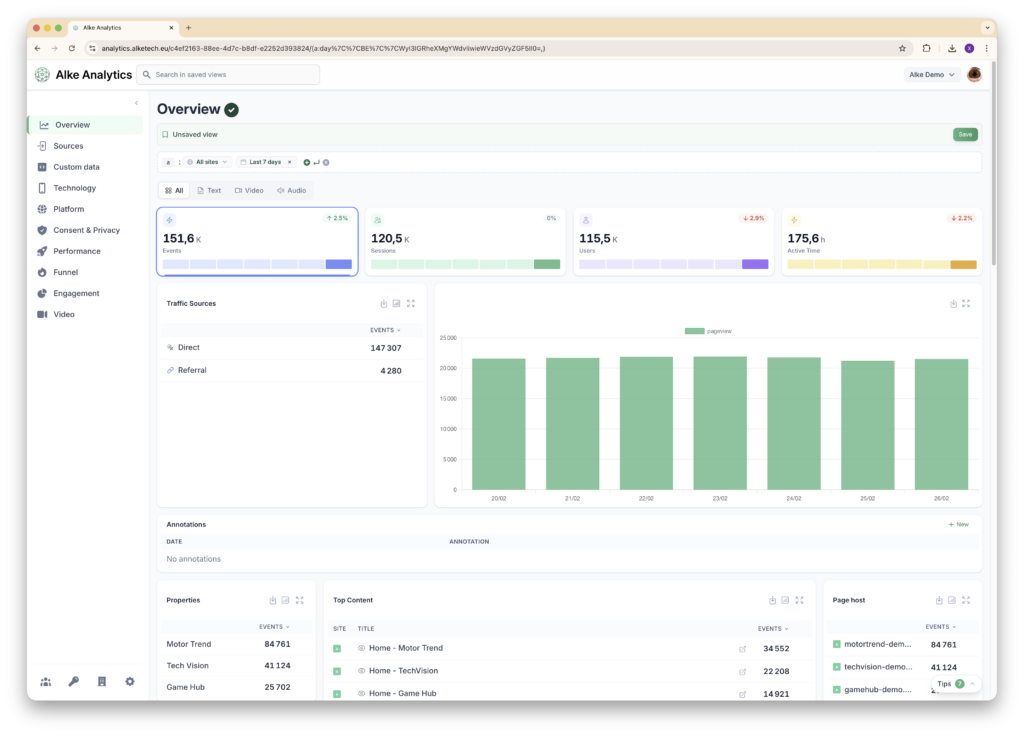
The new design isn’t just cosmetic. It’s faster to navigate and easier to read. It also makes room for the growing number of features and reports in Alke Analytics. Whether you’re on a widescreen monitor or a laptop, the experience is crisp and efficient.
