
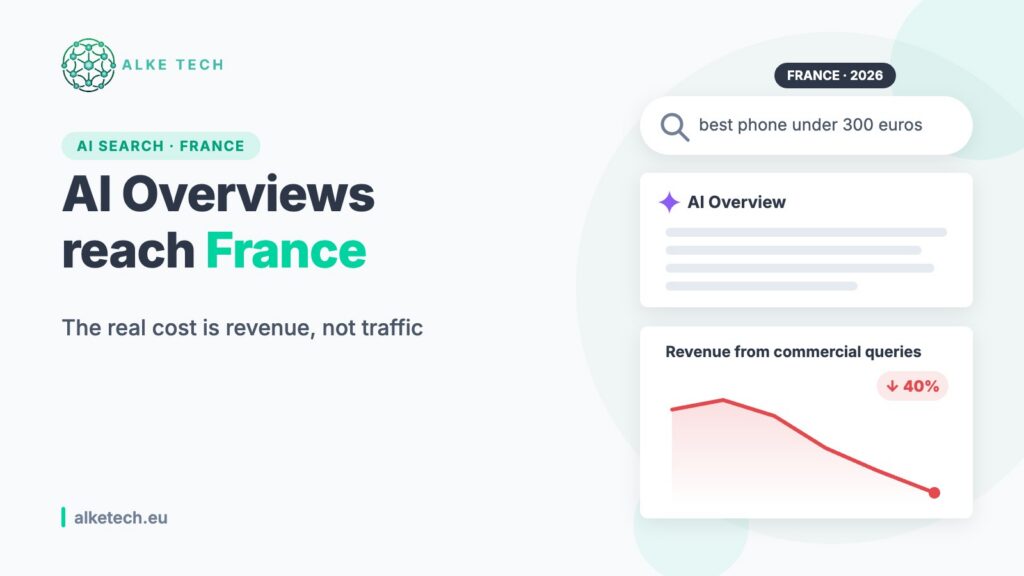
Google’s AI Overviews and AI Mode are rolling out in France this summer. French publishers have watched what happened in the US and the UK for a year. Now it is their turn, and the debate is already framed the wrong way: how much traffic will we lose?
Traffic matters. But the question that will decide the next two years is a different one: how much revenue will we lose, and on which pages?
What the solid data says
Once you set aside studies built on scraping, two sources stand out. Chartbeat data published by the Reuters Institute, covering more than 2,500 news sites, shows Google search referrals down 33% globally over the year to November 2025, 38% in the US and 17% in Europe. Publishers’ own figures, collected by Digital Content Next among its members, point to a median decline of around 7% for news brands.
That 7% has been widely read as good news: news publishers would be “relatively spared”. This reading misses the point. Seven percent of Google traffic that disappears, with no way back, across a group of titles, is a real hole in the P&L. And it is a median: some titles lose far more.
AI is moving down the funnel
The audience numbers hide the real issue. AI Overviews no longer answer only informational questions. According to Semrush, over 2025 the share of commercial queries triggering an AI Overview more than doubled, from about 8% to 18%, while transactional queries went from about 2% to 14%, a sevenfold increase.
These are the “best X”, comparison and buying-guide queries. They feed content commerce and affiliation, the best-paid traffic a publisher has. At a Press Gazette event in October 2025, an affiliate specialist working with publishers reported affiliate revenue drops of 20 to 40% at some of them, as AI Overviews took over review and buying-guide searches.
Losing an informational visit and losing a commercial visit are not the same loss. A traffic chart treats them the same way.
The industry’s blind spot: revenue per query
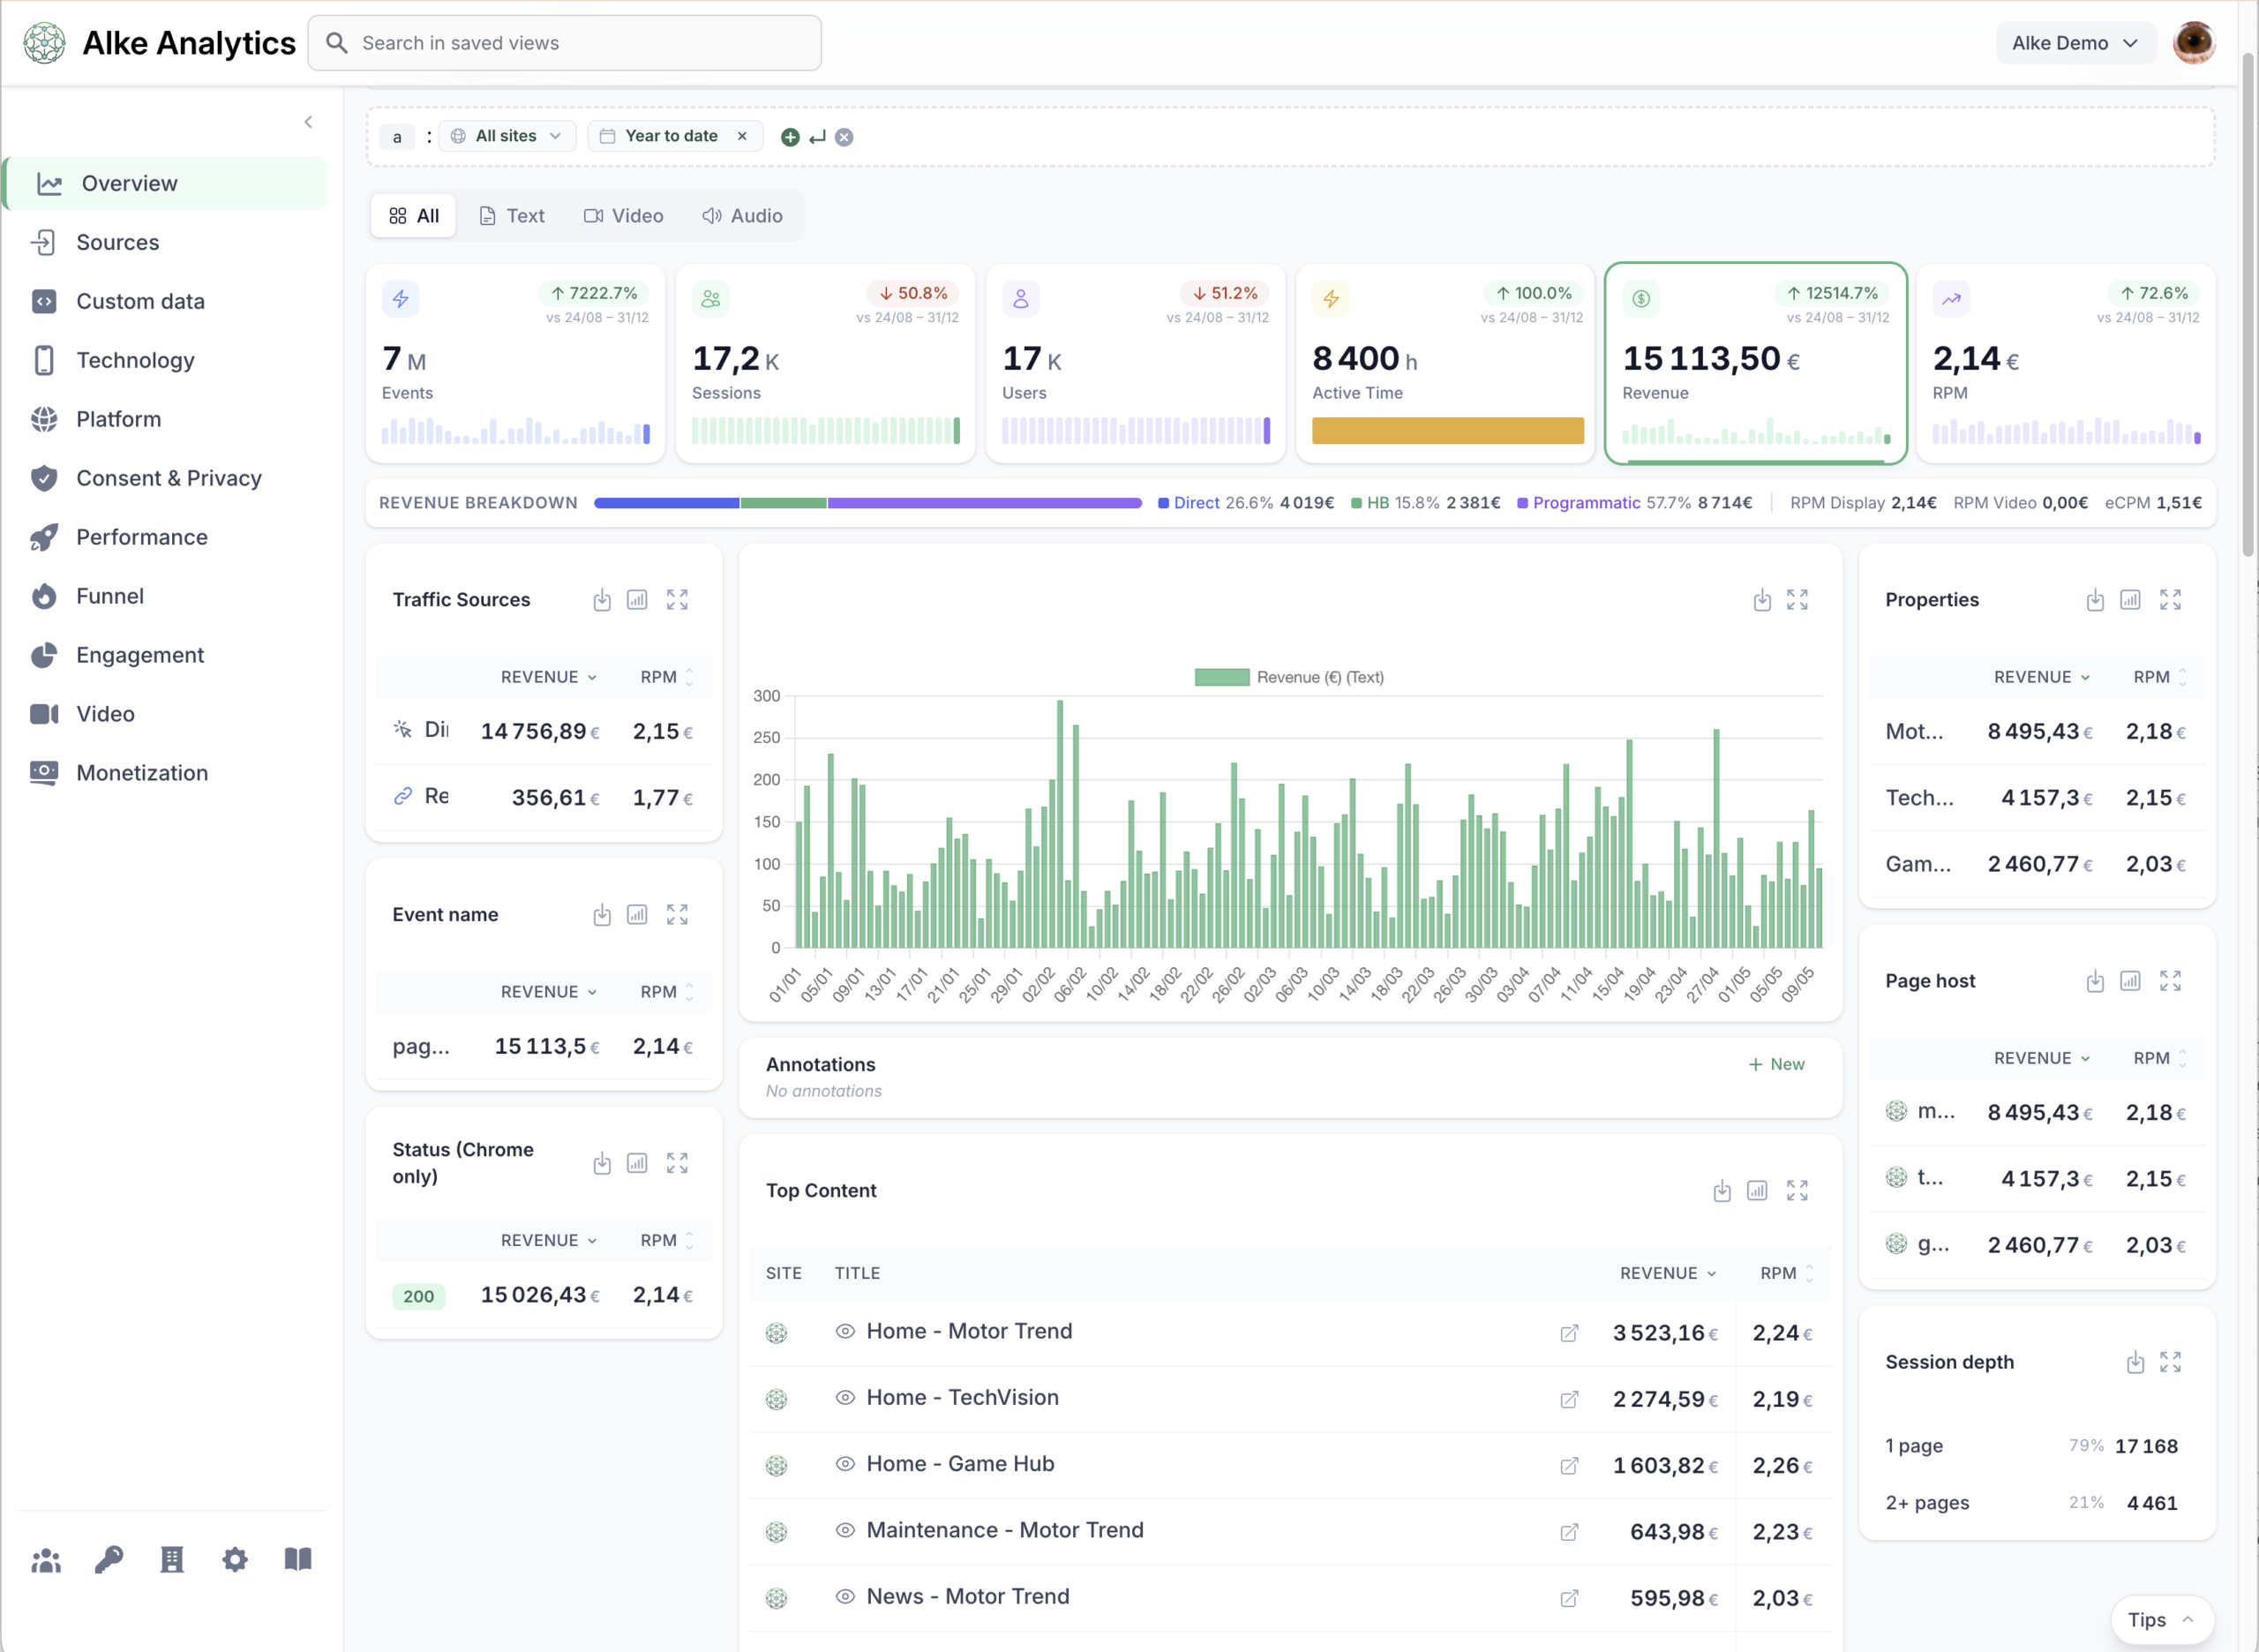
Publishers measure audience very well. They measure revenue by source, by content type and by query very badly. Analytics on one side, ad revenue reports on the other, and nobody can say what a lost search visit on a buying guide was actually worth.
That is the problem we work on at Alke: reconciling audience and monetization at the level of the individual pageview, so that every report can answer in euros and not only in visits. We explained the approach in why publishers can’t answer “which article makes the most money”.
AI Overviews in France: protected, or only delayed?
French media get around two thirds of their traffic from Google, but much of it comes through Discover rather than Search, and AI Overviews do not touch Discover. Hence a widespread sense of safety.
It is misplaced. Discover is a black box. Chartbeat’s figures show it down 21% globally over the same period, and I have seen audiences divided by four overnight after a change nobody announced. Building 70% of your traffic on Discover is not protection from AI Overviews. It is the same exposure, with a time lag.
A first signal from the courts
On 28 May 2026, a court in Munich held Google liable for the content of its AI Overviews, treating them as Google’s own statements rather than as search results. If Google writes the content, it answers for it. The decision is not final, but it is the first time a judge has drawn that line.
For publishers, though, the dilemma remains, and it has no good way out. Staying in AI Overviews means feeding the machine that captures your click. Leaving means handing the space to your competitors. Either way, the publisher loses.
What to measure as AI Overviews roll out in France
The right question for French publishers this summer is simple: can I measure, source by source and page by page, what AI Overviews are really costing me? In practice, that means being able to:
- split Google Search and Google Discover, in revenue and not only in visits;
- isolate the content types exposed to commercial queries (guides, comparisons, reviews) and follow their RPM;
- mark the rollout date on every chart, and compare the weeks before and after;
- see which pages keep their value when traffic drops, and which ones do not.
Publishers who can read this impact in revenue will know where to defend their positions and where to stop investing. The others will discover it at the end of the quarter.
Want to see what your Google traffic is really worth, page by page? Start a free 7-day trial or request a demo.
Sources: Reuters Institute, Journalism, Media and Technology Trends and Predictions 2026 · Press Gazette, Chartbeat data by region · Semrush AI Overviews study · Press Gazette, affiliate revenue and AI Overviews
