
Last month, we put Alke Analytics inside your AI assistant. This month, we kept going in the same direction, with one simple idea: your data should reach the tools your teams already use, and it should be easier to read once it gets there. So the headline is a new Data Studio connector. Next to it, you will find a rebuilt Performance report that finally puts a price on page speed, and a year-over-year comparison on every report. Here is what’s new.
A Data Studio connector for your Alke data
Many publishers build their management dashboards in Google Data Studio (formerly Looker Studio). Until now, getting Alke figures into those dashboards meant exports and copy-pasting. As a result, the board deck often ran on last week’s numbers.
The new Alke Analytics Data Studio connector removes that step. Every dimension and every metric of your reports becomes a field of a Data Studio data source, with the same names as in the dashboard. Revenue fields show up too, for the people who have monetization access.
The right Data Studio numbers, whatever the chart
Most connectors send raw rows and let the BI tool add them up. That works for pageviews. However, it breaks for unique users, ratios and percentiles. Add up daily unique users, for example, and you get a monthly figure that is simply wrong.
The Data Studio connector works the other way around. Alke computes every metric for exactly the dimensions of each chart. So a chart by day shows the unique users of each day, while a scorecard shows the unique users of the whole period. In practice, this means:
- Counts and sums (pageviews, revenue, impressions) add up safely, so Data Studio can rank a top 10 without a warning.
- Unique counts, ratios and averages, such as RPM or pages per session, are locked, so nobody can sum them by mistake.
- Core Web Vitals use the 75th percentile, exactly like the dashboard.
- “Top 10 + Others” breakdowns work, and the Others row equals the total minus the top.
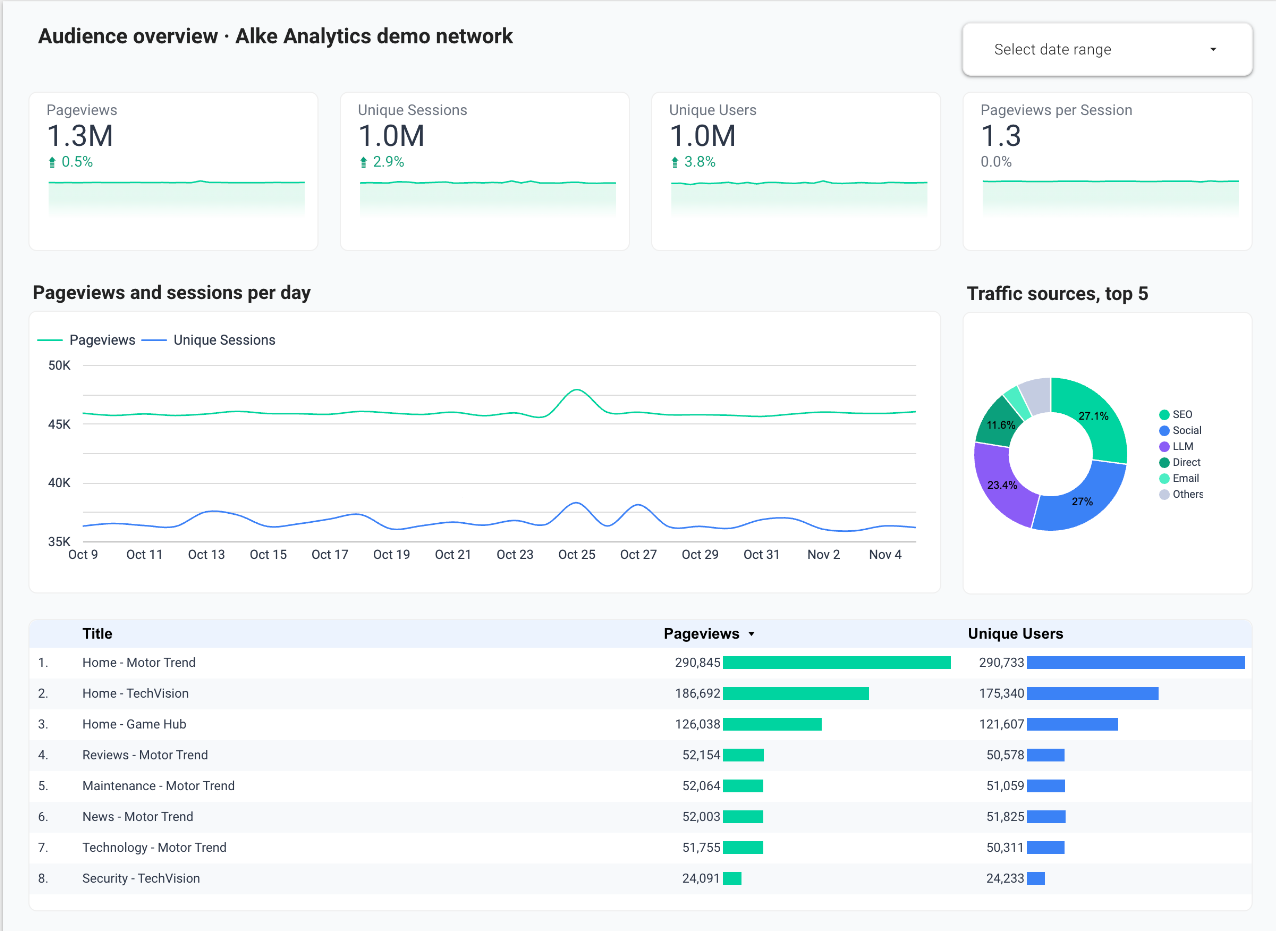
Filters follow the same logic. Alke applies chart, page and report filters before it computes the metrics. When Alke can’t express a filter correctly, the chart says which condition to change instead of quietly showing a wrong figure.
A Data Studio connector that respects your permissions
Each person connects with their own Alke account, and there is no API key to share. Data Studio only sees what that account can see, in the organizations you pick on the consent screen. The connection is read-only, and you can revoke it from Data Studio or from your Alke profile. The connector is available on request: ask your Alke Analytics contact to turn it on for your organization. The setup guide sits in our public documentation, under Integrations › Data Studio.
A Performance report that speaks revenue
Everyone agrees that a slow page costs money. Yet few teams can say how much, which makes speed work hard to prioritize against everything else. We rebuilt the Performance report around that question.
A clear verdict, then the details
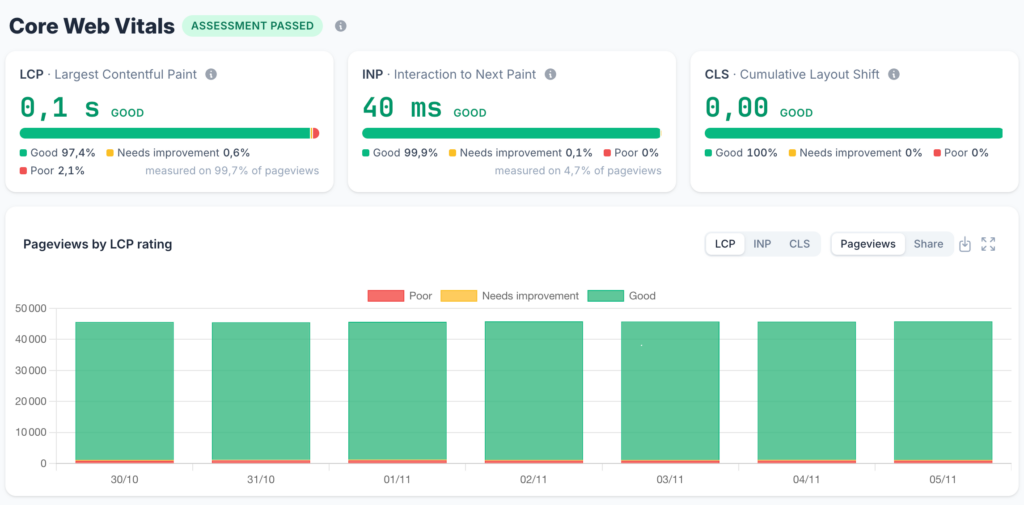
The report now opens with a Core Web Vitals verdict and one card each for LCP, INP and CLS. Each card shows the 75th percentile with its unit and the share of pageviews rated good, needs improvement or poor. It also shows how much of your traffic Alke actually measured. Click a rating, and the whole report filters on it.
These ratings follow Google’s thresholds, and they are now real dimensions. In other words, you can group and filter by them anywhere: in any report, in the pivot table and in your AI assistant.
Business impact, rating by rating
This is the part we are proudest of. For each rating, the new Business impact section shows engagement, active time and RPM. As a result, “poor LCP pages earn less” stops being an intuition. Instead, it becomes a number you can bring to the tech team and to the ad sales team.
The rest of the report helps you decide where to start:
- Priority pages are now ranked by their number of “poor” views, not by their p75. Consequently, a page seen once no longer climbs to the top on noise.
- Segments in tabs: device, page group, browser, country, navigation type and consent banner.
- Trends of pageviews by rating, in volume or in share, for each vital.
- Ad creatives in one table per vital, sorted by volume, with their gap to your site’s p75.
- Loading phases stacked at the 75th percentile, so you can see where the time goes.
Compare with last year, and zoom in on the hour
Media traffic is seasonal. A November that looks weak next to October may well be a great November. That’s why every report can now compare a period with the same period last year.
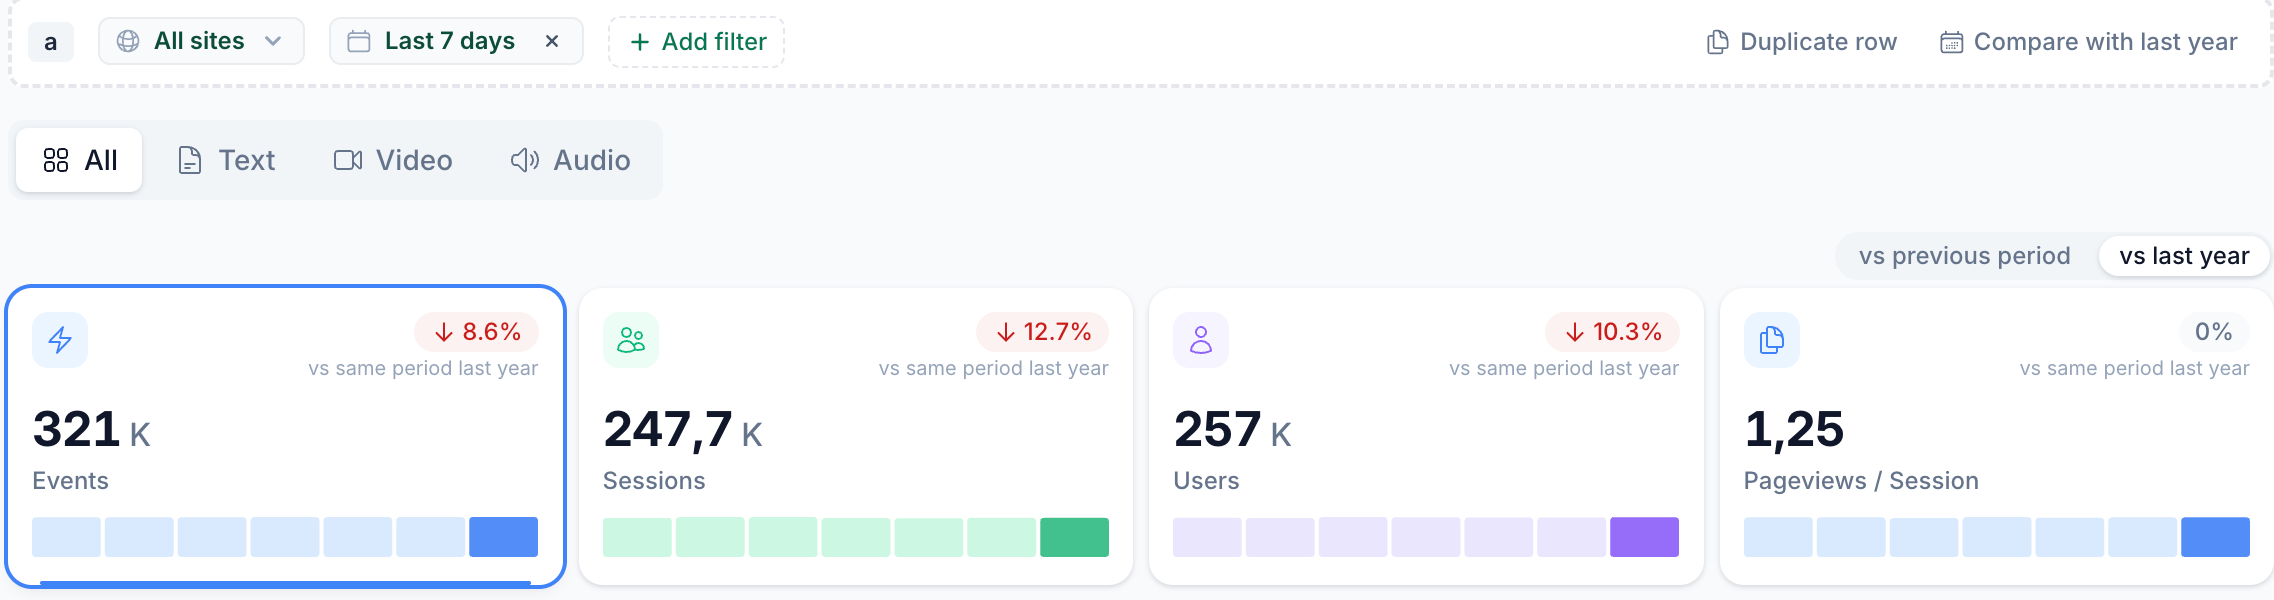
- A toggle on the KPI cards switches the deltas between vs previous period and vs last year.
- A new Compare with last year action on a filter row copies it over the same dates one year earlier. Relative ranges stay relative, so “last 30 days” keeps rolling.
- Saved views remember your comparison choice.
History charts also get a Hour / Day / Month toggle. Hour is available up to 31 days, which is perfect for checking the effect of a push notification or a homepage change. Month kicks in from 90 days. Meanwhile, short ranges such as today or realtime stay by the minute.
Finally, two session KPIs join the dashboard: pageviews per session and average session duration. Both follow the GA4 definitions, which makes side-by-side checks during a migration much simpler.
In brief

- Cover thumbnails in Top Content. Each page now shows its cover image, with your site’s favicon as a badge. Videos carry a play mark and audio a sound wave. We generate and cache thumbnails on the fly, so nothing is stored and nothing hotlinks your servers.
- “% of parent” in the pivot table. A compact column shows each row’s share of the row above it, so you can see at a glance how a section splits into subsections.
- A clearer filter bar. The icons at the end of each row are now labeled buttons: Add filter, Duplicate row and Delete row. When a button is disabled, a tooltip tells you why.
- Less personal data, by default. The collector now strips tokens, such as login codes, session keys and signatures, from page URLs and referrers before anything is stored.
- Security and fixes. We ran a full security review of the platform and fixed what it found. Among the fixes: revenue no longer reads zero after you switch organizations.
Wrapping up
The through-line this month is trust in the number, wherever you read it. Whether you see it in a Data Studio chart, compare it with last year or put a price on a slow page, Alke computes it the same way, and it holds up to a second look.
So open your Performance report, find your slowest pages, and check what they earn.
Want the Data Studio connector on your own data? Reach out and we’ll turn it on for your team.
See what Alke Analytics can do for your properties
Start your free 7-day trial — no credit card required, no commitment.
Start free trial — 7 days · Request a Demo
Written with help of AI.
